
One of the critical tools for facial emotion recognition (a branch of Emotion AI) is the Emotion Chart. In this article, I will discuss what an Emotion Chart is, how it works, and its benefits, including measuring attention level and engagement.
What is an Emotion Chart
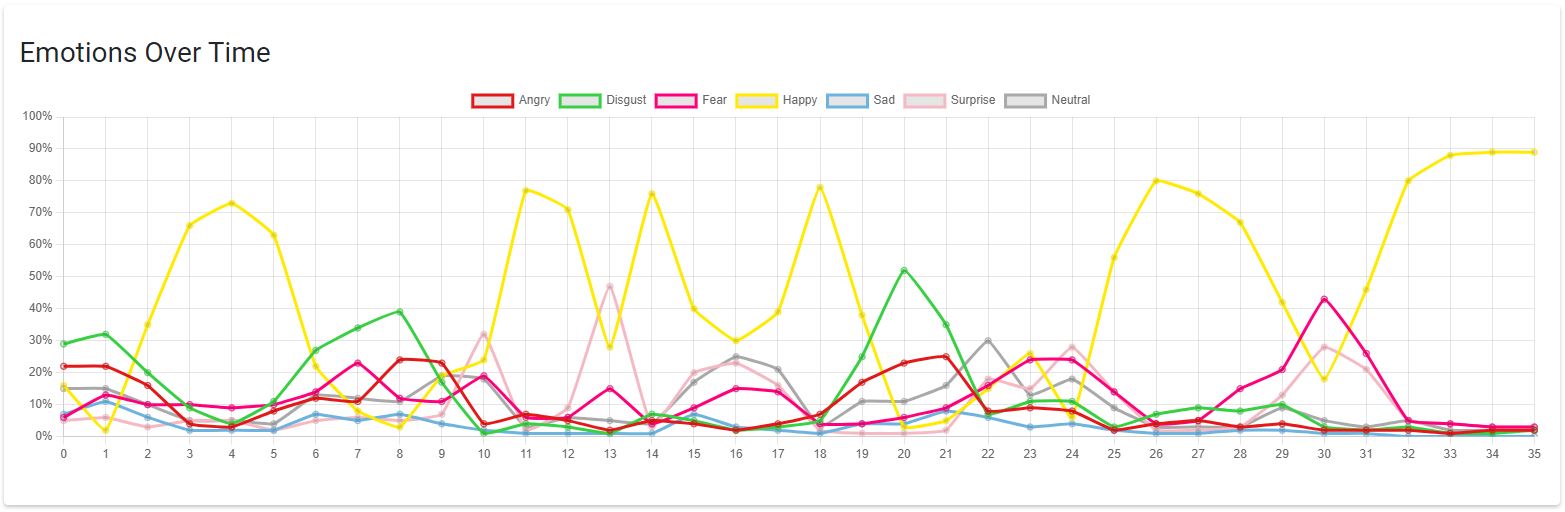
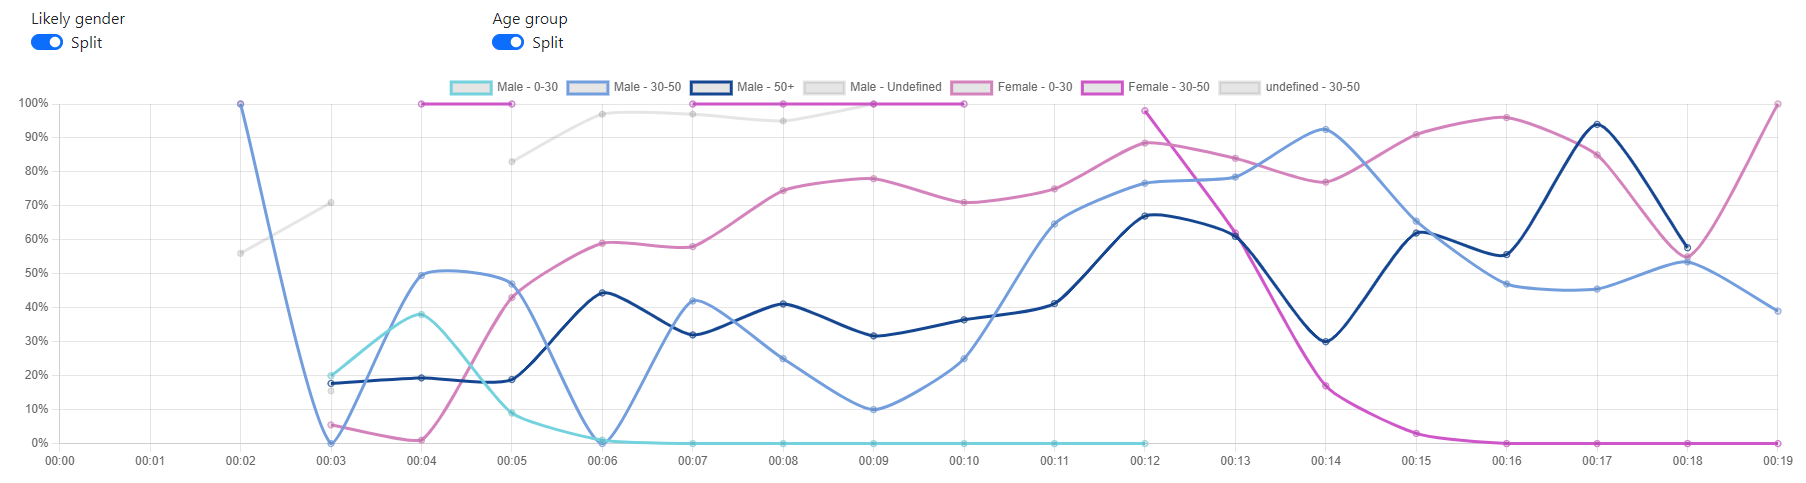
Emotion Charts are graphical representations of the emotional data generated by facial emotion recognition algorithms. These charts provide (in real time and also in archived dashboards) a visual representation of how users are feeling. They show the prevalence of emotions such as happiness, sadness, anger, fear, disgust, and surprise. They can also show metrics such as attention level and engagement.
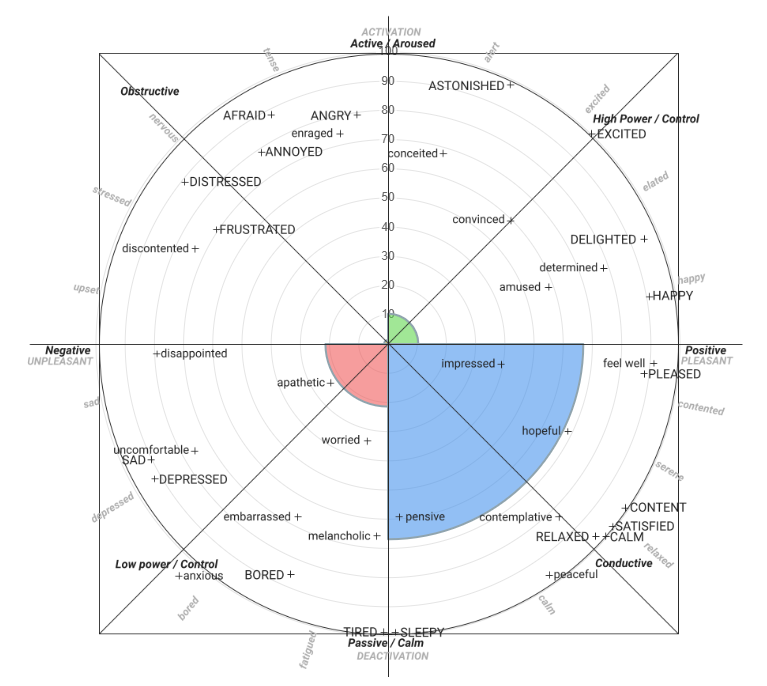
Some providers offer also a deep analysis of Affects based on more modern models.
These information are critical in many fields, including education, healthcare, and marketing. In these fields it is essential to understand how people are interacting with content and products.
Attention and Engagement
Attention level is a metric that measures the degree of focus that a person has on a particular task or object. MorphCast proprietary technology can monitor where a person is looking through head position. It also uses other secret parameters to determine users’ level of attention.
Engagement is a metric that measures the level of interest or involvement that a person has with a particular task or object. Facial emotion recognition algorithms can analyze facial expressions to determine a person’s level of engagement. For example, a person who is displaying a high level of engagement may show more frequent smiling, nodding, or other positive facial expressions. You can use these metrics to measure the effectiveness of marketing campaigns or educational materials.
By combining this data with the emotional data, the system can provide insights into how different emotions are associated with attention levels and engagement.
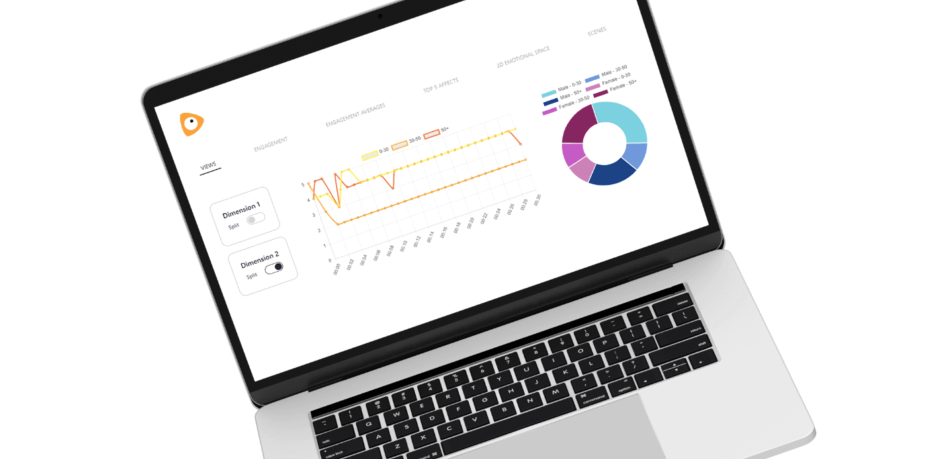
All this can be visualized in a dashboard containing line and pie, 2d and 3d spatial graphs.
Benefits of Emotion Charts
Emotion Charts have several benefits for users. In education, you can use them to monitor students’ emotional response to different learning materials. This enables teachers to adjust their teaching strategies to better engage students. In marketing, you can use them to measure customer sentiment and tailor marketing strategies accordingly. In healthcare, you can use them to track patients’ emotional state over time. This provides valuable insights into the effectiveness of treatments.
Emotion Charts and Facial Emotion Recognition
Emotion Charts are an essential tool for users in the field of facial emotion recognition. They provide a visual representation of emotional data generated by facial emotion recognition algorithms. And this enables users to better understand how they are feeling. The ability to measure attention level and engagement makes these charts even more valuable, providing insights into how people are interacting with content and products. As the field continues to advance, Emotion Charts will play a critical role in developing more accurate and effective systems for a wide range of applications.