


Last Update Nov 11, 2025
Dive into the heart of Emotion AI with our expertly crafted guide, designed to elucidate the nuanced realm of human emotions through advanced AI technology. This guide offers a clear, in-depth explanation of all the charts and analytical tools used in the MorphCast product, aiming to demystify the complex emotional data retrieved by our cutting-edge AI. Whether you’re a professional in the field or an enthusiast eager to explore the depths of emotional insights, this resource is tailored to enhance your understanding and application of Emotion AI in various real-world scenarios.
In response to frequent requests from clients for a tutorial on interpreting the signals output of our Emotion AI, we have developed this tutorial. It is dedicated to deepening the understanding of what our AI tracks and how to utilize this data effectively. We’ll take you through both the real-time graphs and the dashboard analytics, including how to read and apply the information presented in various formats such as PDF graph layouts and CSV and JSON files. This comprehensive tutorial is designed to empower you with the knowledge to interpret and leverage Emotion AI data with confidence and clarity.
We also invite you to consult our documentation titled “Beyond the Algorithm: Building Trustworthy Emotion AI at MorphCast,” in which you will find comprehensive explanations about what our AI tracks, the active modules, and transparent information about the features and limitations of our technology. Additionally, this documentation outlines the practices we employ to ensure data safety, protect privacy, and reduce environmental impact.
Understanding Arousal and Valence
In the exploration of human emotions, the concepts of arousal and valence emerge as fundamental dimensions, offering a nuanced lens through which to view our affective experiences. These dimensions, central to Russell’s circumplex model of affect, provide a structured approach to deciphering the complex tapestry of human emotions. Understanding these concepts not only enriches our grasp of emotional states but also underpins the development of technologies such as Emotion AI, which seeks to interpret and simulate human affects with precision.
Arousal: The Spectrum of Alertness
Arousal represents the level of alertness or physiological and psychological activation in an individual, ranging across a continuum from low to high. At the low end of this spectrum, we find states of sleepiness or lethargy, characterized by a lack of energy or enthusiasm. Conversely, high arousal is marked by heightened states of alertness or excitement, where an individual may feel energized or intensely focused. This dimension underscores the intensity of an emotional experience, without dictating the nature of the emotion as positive or negative.
Valence: The Attractiveness or Averseness
Valence, on the other hand, addresses the intrinsic attractiveness (positive valence) or averseness (negative valence) of an event, object, or situation, essentially defining the emotional direction. Positive valence encompasses emotions such as happiness, joy, and love, reflecting a sense of satisfaction or pleasure. Negative valence includes emotions like sadness, anger, and fear, indicative of discomfort or displeasure. Thus, valence helps in understanding the desirability of the emotional state experienced by an individual.
Mapping Emotions in a 2D Circumplex Space
Russell’s circumplex model of affect ingeniously integrates these dimensions into a 2D space, where arousal and valence are plotted on orthogonal axes. This arrangement allows for a comprehensive mapping of a wide range of emotions, providing a visual and conceptual framework to distinguish between them. For example, excitement is characterized by high arousal and positive valence, whereas sadness is marked by low arousal and negative valence. Anxiety, with its high arousal and negative valence, contrasts with relaxation, which combines low arousal with positive valence.
This 2D circumplex space not only aids in the academic understanding of emotions but also serves as a foundational model for Emotion AI technologies. By analyzing cues that indicate specific levels of arousal and valence, these technologies can accurately interpret human emotions, enabling machines to respond to human needs and states in a more empathetic and nuanced manner.
In summary, the concepts of arousal and valence, as delineated by Russell’s circumplex model, are instrumental in deciphering the complex world of human emotions. By categorizing emotions along these dimensions, we gain insights into the physiological and psychological underpinnings of emotional states, paving the way for advancements in technology that can enhance human-machine interactions through a deeper understanding of human affect.
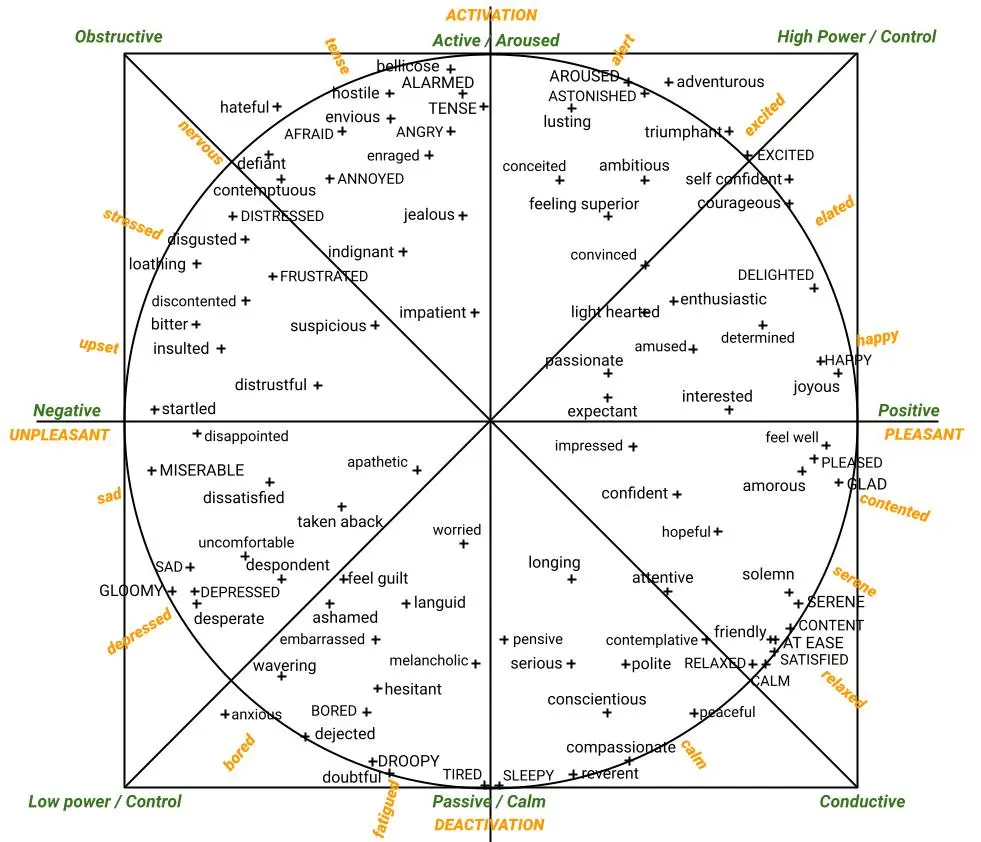
The 98 Affects
The words listed are adjectives describing emotions, feelings, and mental states, which are fundamental aspects of human psychology and emotional intelligence. The scientific basis for understanding these words and the concepts they represent comes from various fields of study, including psychology, neuroscience, and even sociology. Here’s a deeper look into the scientific background related to these words:
Psychology
Psychology, the study of mind and behavior, is the primary discipline that investigates emotions and feelings. It examines how emotions are experienced, processed, and expressed by individuals. Theories of emotion in psychology, such as the James-Lange theory, the Cannon-Bard theory, and the Schachter-Singer theory, offer different explanations for how physiological reactions, cognitive assessments, and environmental interactions contribute to the experience of emotions.
Neuroscience
Neuroscience explores the biological underpinnings of emotional experiences by studying the brain and nervous system. Research in this field has identified specific brain regions associated with emotional processing, such as the amygdala, prefrontal cortex, and hippocampus. Neurotransmitters like dopamine, serotonin, and norepinephrine play significant roles in regulating mood and emotions. For example, the amygdala is crucial for processing fear, making it central to understanding emotions like fear, anxiety, and alarm.
Sociology and Anthropology
Sociology and anthropology study emotions from a social and cultural perspective, looking at how emotions are experienced, expressed, and understood within different societies and cultural contexts. These fields recognize that cultural norms and values significantly influence how emotions are expressed and perceived, suggesting that while the capacity for emotion is universal, the expression and interpretation of emotions can be culturally specific.
Emotional Intelligence
Emotional intelligence (EI) is a concept that encompasses the ability to recognize, understand, manage, and use one’s own emotions positively to communicate effectively, empathize with others, overcome challenges, and defuse conflict. EI has become a valuable framework in both personal development and professional environments, emphasizing the importance of emotions in human interaction and decision-making.
Evolutionary Psychology
Evolutionary psychology provides insights into why humans experience emotions and how these emotions have played a role in survival and reproduction. Emotions like fear, love, and anger can be seen as adaptive responses to environmental challenges and opportunities faced by our ancestors, influencing behavior in ways that increased the likelihood of survival and reproductive success.
Summary
The scientific understanding of emotions and related concepts is multidisciplinary, drawing on insights from psychology, neuroscience, sociology, anthropology, and evolutionary biology. These fields together provide a comprehensive view of why humans experience a wide range of emotions, how these emotions affect behavior and decision-making, and how they have evolved over time. The study of emotions is ongoing, with new discoveries continually enhancing our understanding of the complex interplay between brain, mind, body, and society in the realm of emotional experience.
- Adventurous: Willing to take risks or try out new methods, ideas, or experiences.
- Afraid: Feeling fear or anxiety; frightened.
- Alarmed: Worried or frightened by something unexpected.
- Ambitious: Having a strong desire for success or achievement.
- Amorous: Showing, feeling, or relating to sexual desire.
- Amused: Finding something funny or entertaining.
- Angry: Feeling or showing strong annoyance, displeasure, or hostility.
- Annoyed: Slightly angry; irritated.
- Anxious: Experiencing worry, unease, or nervousness.
- Apathetic: Showing or feeling no interest, enthusiasm, or concern.
- Aroused: Stirred to action; excited, or sexually stimulated.
- Ashamed: Embarrassed or guilty because of one’s actions, characteristics, or associations.
- Astonished: Greatly surprised or impressed; amazed.
- At Ease: A state of comfort without anxiety or stress.
- Attentive: Paying close attention to something.
- Bellicose: Demonstrating aggression and willingness to fight.
- Bitter: Showing anger, hurt, or resentment because of bad experiences or a sense of unjust treatment.
- Bored: Feeling weary because one is unoccupied or lacks interest in their current activity.
- Calm: Not showing or feeling nervousness, anger, or other strong emotions; peaceful.
- Compassionate: Feeling or showing sympathy and concern for others.
- Conceited: Excessively proud of oneself; vain.
- Confident: Feeling or showing certainty about something.
- Conscientious: Wishing to do one’s work or duty well and thoroughly.
- Contemplative: Expressing or involving prolonged thought.
- Contemptuous: Showing contempt; scornful.
- Content: In a state of peaceful happiness.
- Convinced: Completely certain about something.
- Courageous: Not deterred by danger or pain; brave.
- Defiant: Showing defiance; boldly resistant or challenging.
- Dejected: Sad and depressed; dispirited.
- Delighted: Feeling or showing great pleasure.
- Depressed: In a state of general unhappiness or despondency.
- Desperate: Feeling a hopeless sense that a situation is so bad as to be impossible to deal with.
- Despondent: In low spirits from loss of hope or courage.
- Determined: Having made a firm decision and being resolved not to change it.
- Disappointed: Sad or displeased because someone or something has failed to fulfill one’s hopes or expectations.
- Discontented: Dissatisfied, especially with one’s circumstances.
- Disgusted: Feeling revulsion or profound disapproval.
- Dissatisfied: Not content or happy with something.
- Distressed: Experiencing anxiety, sorrow, or pain.
- Distrustful: Unable to trust someone or something.
- Doubtful: Feeling uncertain about something.
- Droopy: Depressed or lacking energy.
- Embarrassed: Feeling ashamed and uncomfortable.
- Enraged: Very angry; furious.
- Enthusiastic: Showing intense and eager enjoyment, interest, or approval.
- Envious: Feeling or showing envy.
- Excited: Feeling or showing happiness and enthusiasm.
- Expectant: Having or showing an excited feeling that something is about to happen, especially something pleasant and interesting.
- Feel Guilt: Experiencing a feeling of responsibility or remorse for some offense, crime, wrong, etc., whether real or imagined.
- Feel Well: Experiencing a state of physical or mental health or well-being.
- Feeling Superior: Believing oneself to be better than others.
- Friendly: Kind and pleasant.
- Frustrated: Feeling or expressing distress and annoyance resulting from an inability to change or achieve something.
- Glad: Feeling pleasure or joy.
- Gloomy: Dark or poorly lit, especially so as to appear depressing or frightening.
- Happy: Feeling or showing pleasure or contentment.
- Hateful: Feeling or showing hate.
- Hesitant: Tentative, unsure, or slow in acting or speaking.
- Hopeful: Feeling or inspiring optimism about a future event.
- Hostile: Unfriendly; antagonistic.
- Impatient: Having or showing a tendency to be quickly irritated or provoked.
- Impressed: Feeling admiration or respect towards something or someone.
- Indignant: Feeling or showing anger or annoyance at what is perceived as unfair treatment.
- Insulted: Feeling offended or disrespected.
- Interested: Showing curiosity or concern about something or someone; eager to know or learn more.
- Jealous: Feeling or showing envy of someone or their achievements and advantages.
- Joyous: Full of happiness and joy.
- Languid: Displaying or having a disinclination for physical exertion or effort; slow and relaxed.
- Light Hearted: Carefree and cheerful.
- Loathing: A feeling of intense dislike or disgust; hatred.
- Longing: A yearning desire.
- Lusting: Having a strong sexual desire.
- Melancholic: Characterized by or showing deep sadness or depression.
- Miserable: Very unhappy or uncomfortable.
- Passionate: Showing or caused by strong feelings or a strong belief.
- Peaceful: Free from disturbance; tranquil.
- Pensive: Engaged in, involving, or reflecting deep or serious thought.
- Pleased: Feeling or showing pleasure and satisfaction, especially at an event or a situation.
- Polite: Having or showing behavior that is respectful and considerate of other people.
- Relaxed: Free from tension and anxiety; at ease.
- Reverent: Feeling or showing deep and solemn respect.
- Sad: Feeling or showing sorrow; unhappy.
- Satisfied: Pleased because one has achieved what one wanted or because something has happened in a way that one wanted.
- Self Confident: Trusting in one’s abilities, qualities, and judgment.
- Serene: Calm, peaceful, and untroubled; tranquil.
- Serious: Solemn or thoughtful in character or manner.
- Sleepy: Needing or ready for sleep.
- Solemn: Formal and dignified; not cheerful or smiling; serious.
- Startled: Feeling or showing sudden shock or alarm.
- Suspicious: Having or showing a cautious distrust of someone or something.
- Taken Aback: Surprised and confused so much that one is unsure how to react.
- Tense: Anxious or nervous.
- Tired: In need of rest or sleep; weary.
- Triumphant: Having won a battle or contest; victorious.
- Uncomfortable: Causing or feeling slight pain or physical discomfort.
- Wavering: Showing indecision or hesitation.
- Worried: Anxious or troubled about actual or potential problems.
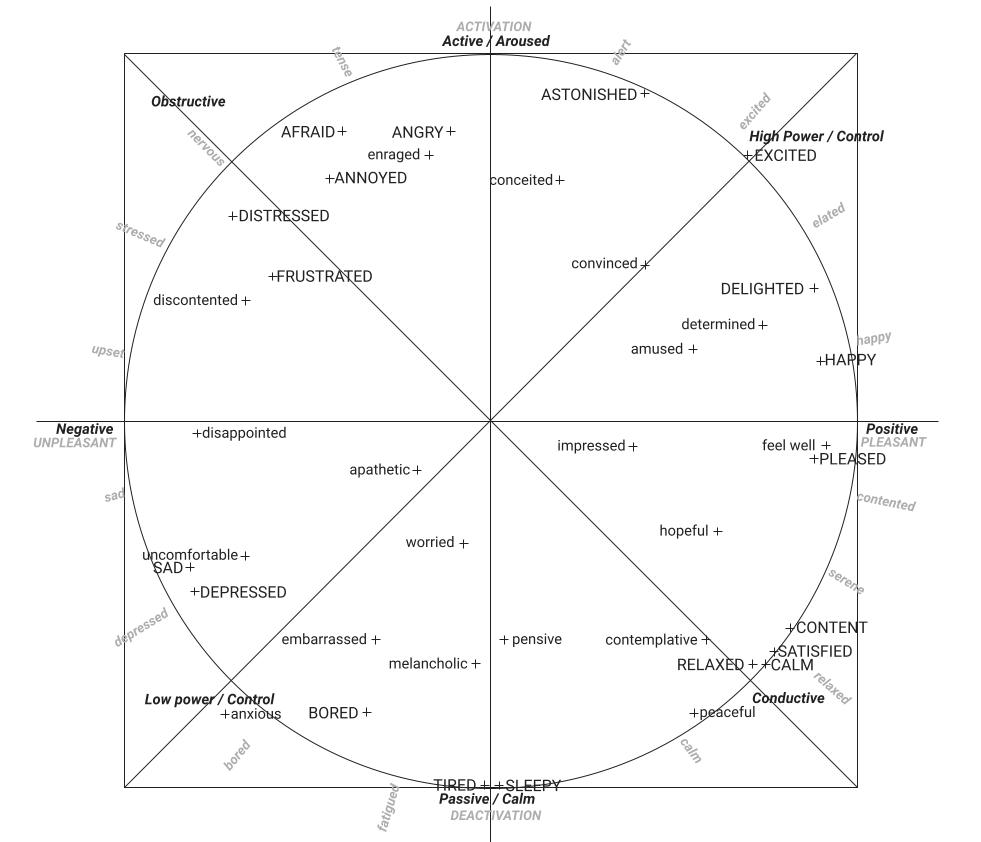
Uppercase and Lowercase Affects Representation on Enhancing Emotional Semantics: The Integration of Scherer’s Extensions into Russell’s Circumplex Model
The usage of uppercase and lowercase in the representation of Russell’s model, as described in *2, helps differentiate between the original terms used by Russell (1983) to define his circumplex model of emotions in a two-dimensional space of valence and arousal/activation (represented in uppercase) and the additional terms introduced by Scherer based on the similarity ratings of 80 German emotion terms (translated to English and represented in lowercase). This differentiation serves as a visual tool to distinguish between Russell’s core concepts within the circumplex model and Scherer’s extensions that enrich the model by incorporating a broader semantic space of emotions related to appraisal and coping mechanisms.
Scherer’s analysis superimposes a two-dimensional structure based on the similarity of these emotion terms onto Russell’s representation, demonstrating a significant fit and suggesting that the inclusion of additional terms, beyond those originally conceptualized by Russell, could enhance our understanding of the emotional semantic space. Importantly, Scherer’s addition of terms, represented in lowercase, allows for a nuanced exploration of emotions beyond Russell’s initial framework, aligning with the appraisal criteria assumed to organize the semantic space of emotions.
Bibliography:
- *1 – Russell, J., Lewicka, M. & Niit, T. (1989). A cross-cultural study of a circumplex model of affect. Journal of personality and social psychology, 57, 848–856.
- *2 – Scherer, Klaus. (2005). Scherer KR. What are emotions? And how can they be measured? Soc Sci Inf 44: 695-729. Social Science Information. 44. 695-792.
- *3 – Ahn, Junghyun & Gobron, Stéphane & Silvestre, Quentin & Thalmann, Daniel. (2010). Asymmetrical Facial Expressions based on an Advanced Interpretation of Two-dimensional Russell Emotional Model.
- *4 – Paltoglou, G., & Thelwall, M. (2012). Seeing stars of valence and arousal in blog posts. IEEE Transactions on Affective Computing, 4(1), 116-123.
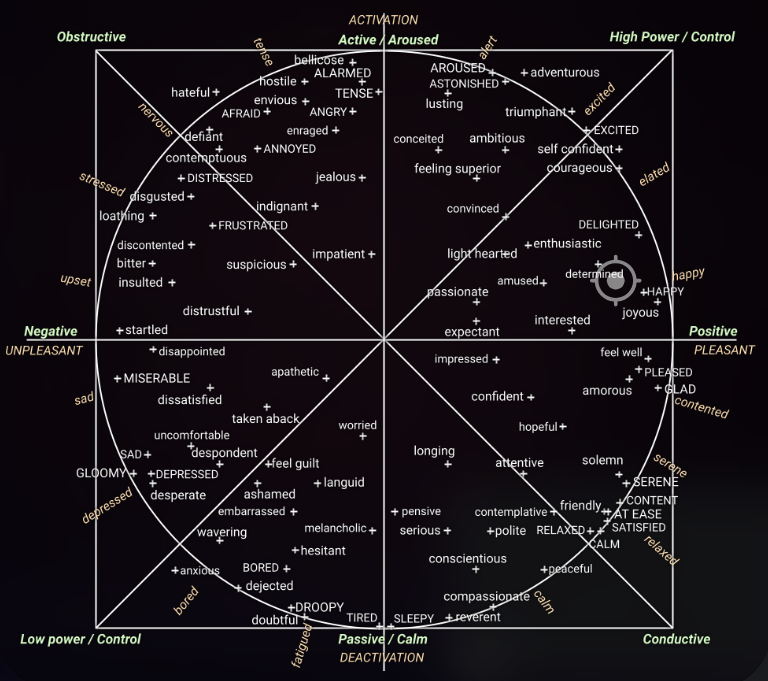
Affect Pointer
Do you want to experience this functionality firsthand? Open this DEMO URL, and you will see the pointer working on your face.
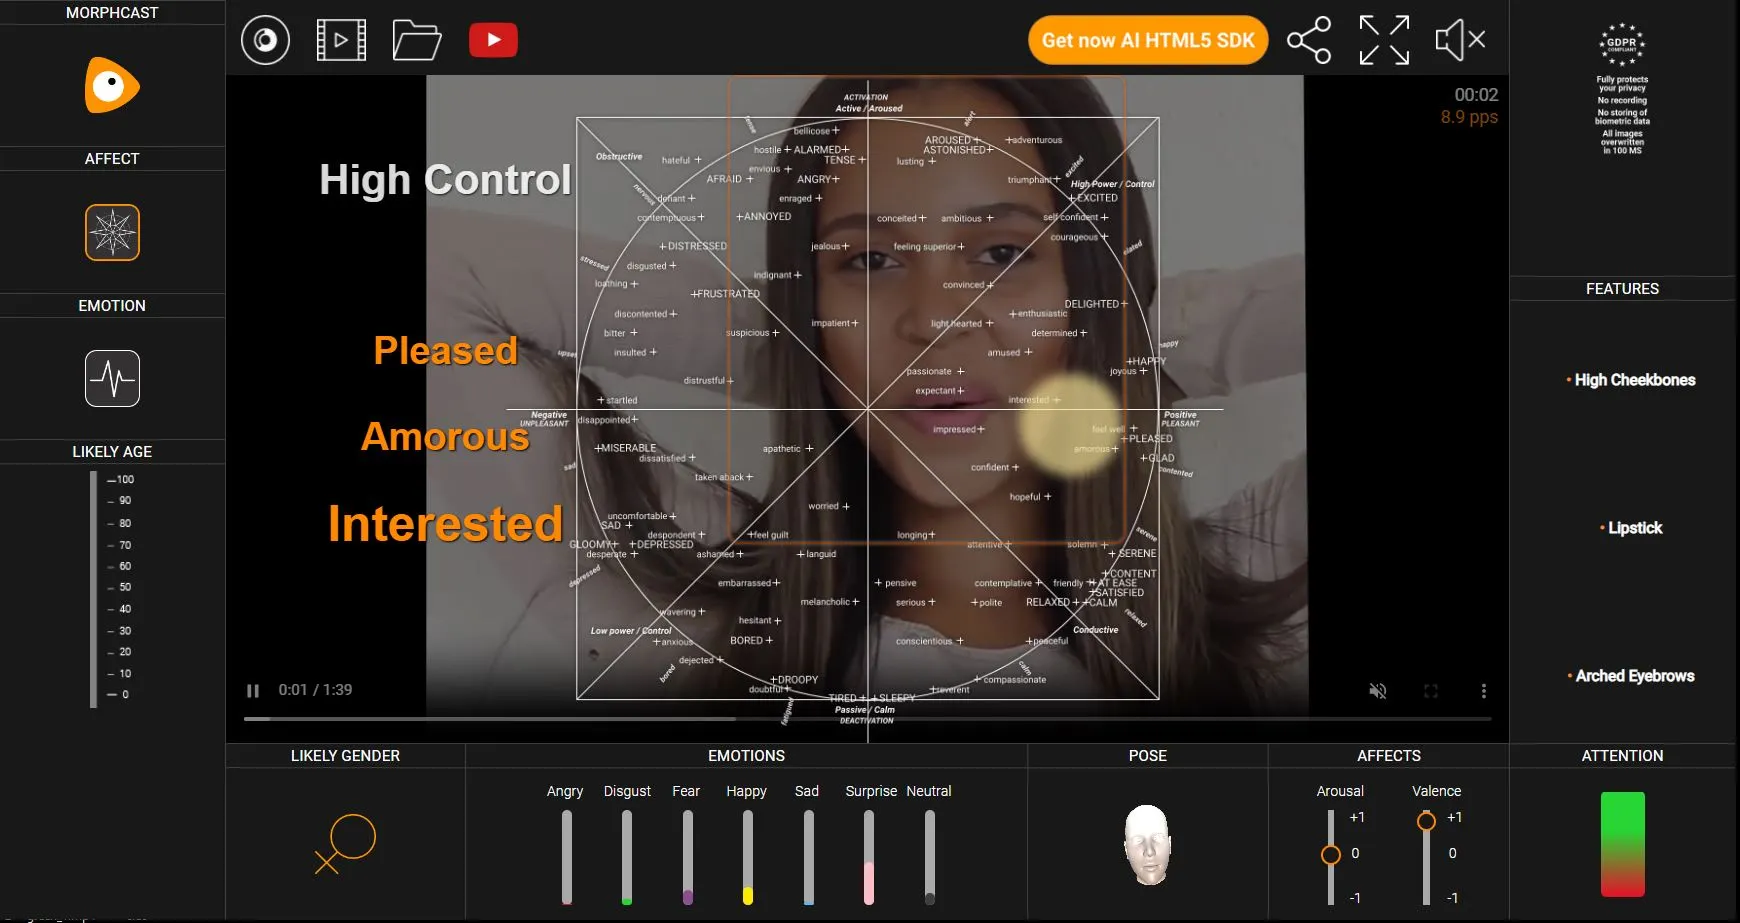
The chart you are looking at represents the circumplex model of affect, a two-dimensional system used to visually map human emotions. This model is based on emotion psychology theories that classify affective states along two main dimensions: arousal and valence.
Functionality of the Pointer
The gray pointer with crosshairs indicates the current position of a specific affect detected in real-time on a person’s face. This position can change dynamically as the person experiences and displays different emotions, whether they are watching a video or being observed via a camera in an interactive session.
Dimensions of the Model
Horizontal Axis (Valence): Ranges from “unpleasant” to “pleasant” and represents the positivity or negativity of the emotional experience.
Vertical Axis (Arousal): Ranges from “deactivation” to “activation” and indicates the intensity of the emotion, from calm or passive to excited or agitated.
Interpretation and Usage
Quadrant Identification:
The chart is divided into four quadrants representing different combinations of valence and arousal.
The pointer moves to the appropriate quadrant based on the detected emotion: for example, an affect located in the upper right quadrant indicates a positive and activated emotion like joy or excitement.
Conversely, an affect in the lower left quadrant would indicate a negative and passive emotion such as sadness or depression.
Real-Time Monitoring:
The real-time movement of the pointer allows you to track how emotions shift during video viewing, videoconferencing, or other interactive sessions.
Practical Applications:
This tool is invaluable for professionals like psychologists, marketers, or user experience designers who wish to understand and respond to emotional reactions.
In the educational field, it can be used to tailor teaching to the emotional states of students, enhancing engagement and the learning process.
In marketing and advertising, it enables the assessment of the emotional impact of content and its optimization for greater effectiveness.
Conclusion
Utilizing this chart and its associated pointer in the guide provides an instantaneous, scientifically grounded understanding of emotional reactions. By highlighting affects in real-time, this instrument becomes an essential asset for those interested in measuring and understanding the emotional impact of their content or interactions, enabling refined communication strategies and an improved overall user experience.
Affect Mapper
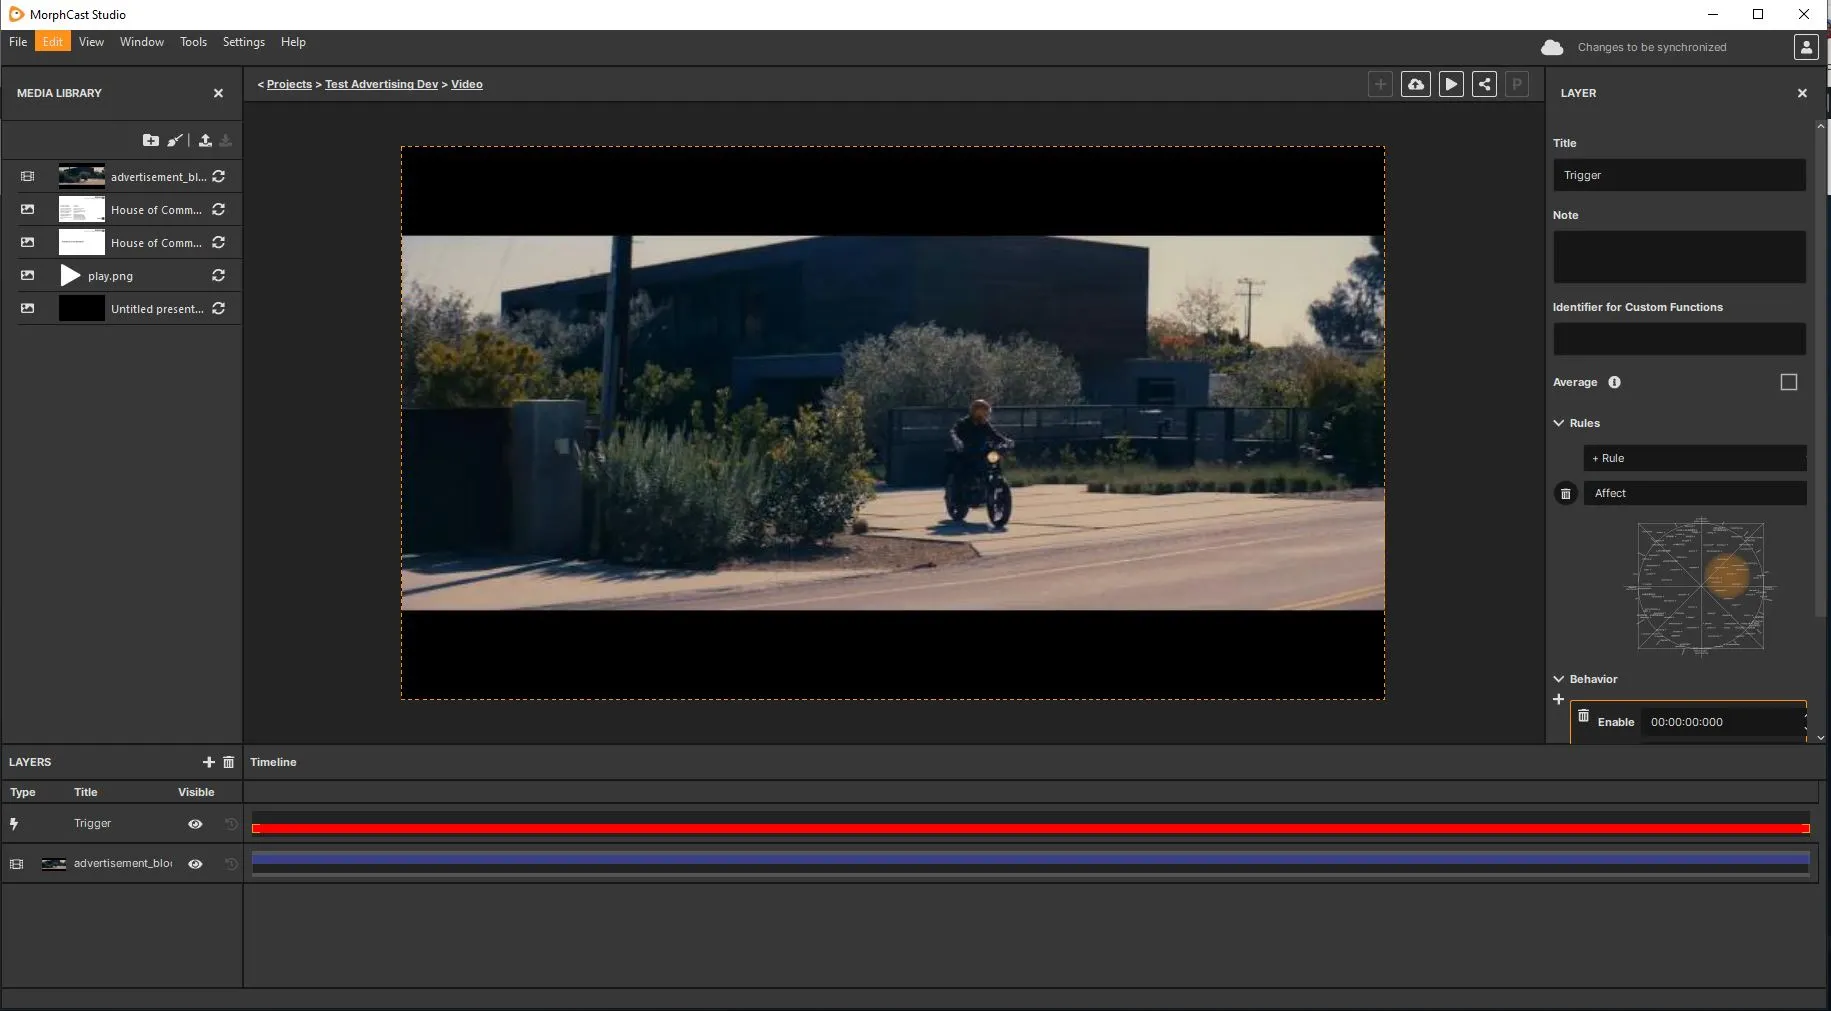
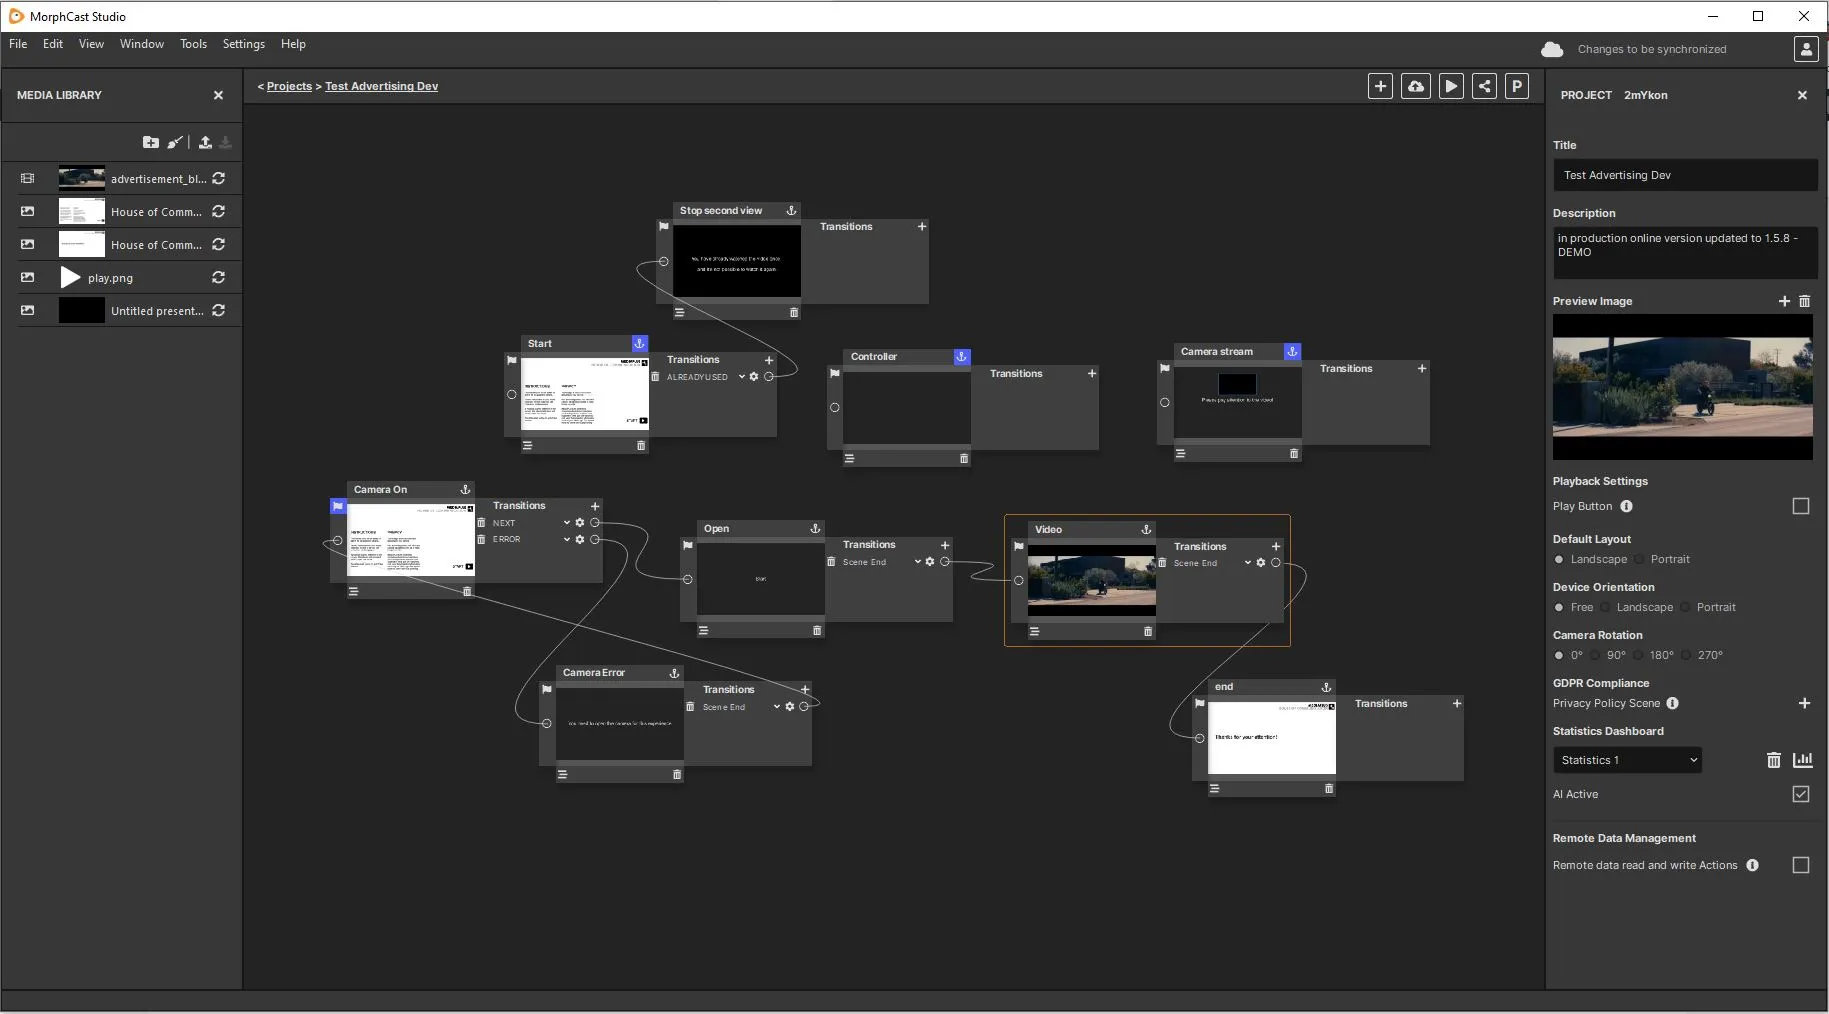

The image represents affect area selectors used in MorphCast Powered videoconferencing products and in MorphCast Studio, a tool for developing projects within the Emotion AI Interactive Media Platform. This mapper tool allows users to target specific emotional states by positioning several area pointers within a quadrant of the circumplex model of affect. By adjusting the radius of the circle, one can set the threshold for triggering events when the analyzed face in real-time during the media experience expresses emotions falling within the map’s circles.
Guide Explanation for the Affect Area Mapper
In MorphCast Studio, the affect area mapper is a powerful feature that enables creators to design interactive media that respond dynamically to the user’s emotional state. Here’s how it works:
Positioning the Area Pointer:
The creator can move the pointer to any location on the circumplex model, which represents the emotional landscape from negative to positive valence (left to right) and low to high arousal (bottom to top).
Adjusting the Radius:
The radius of the pointer can be increased or decreased, allowing the creator to encompass a broader or more specific range of emotional states.
This flexibility means that a larger radius could capture a general mood, while a smaller radius could target a precise emotional response.
Event Triggering:
When the real-time emotional analysis of a user’s face matches the emotions within the selector’s area, predefined interactive events are triggered.
These events could range from changing scenes, creating visual splashes, starting videos, displaying graphics or text, to even summoning an avatar that interacts with the viewer.
Interactive Media Applications:
This functionality enables a deeply engaging user experience where the content adapts in real-time to the viewer’s emotions.
For example, if a user shows increased arousal and positive valence (indicating excitement or joy), the media could respond with upbeat music or vibrant visuals to enhance the positive experience.
Practical Usage:
Interactive media creators can use this tool to craft experiences that are not only reactive but also empathetic to the emotional journey of the user.
The affect area selector thus serves as a bridge between emotion recognition technology and storytelling, creating a new layer of interactivity.
Accessibility:
MorphCast Studio, providing this sophisticated level of emotional interactivity, is available for free on the Apple or Microsoft store, making it accessible for creators looking to explore the cutting edge of Emotion AI within interactive media.
By utilizing the affect area selector, creators using MorphCast Studio can build experiences that are responsive and personalized, offering a new dimension of engagement that resonates on an emotional level with the user.
Top Five Affects
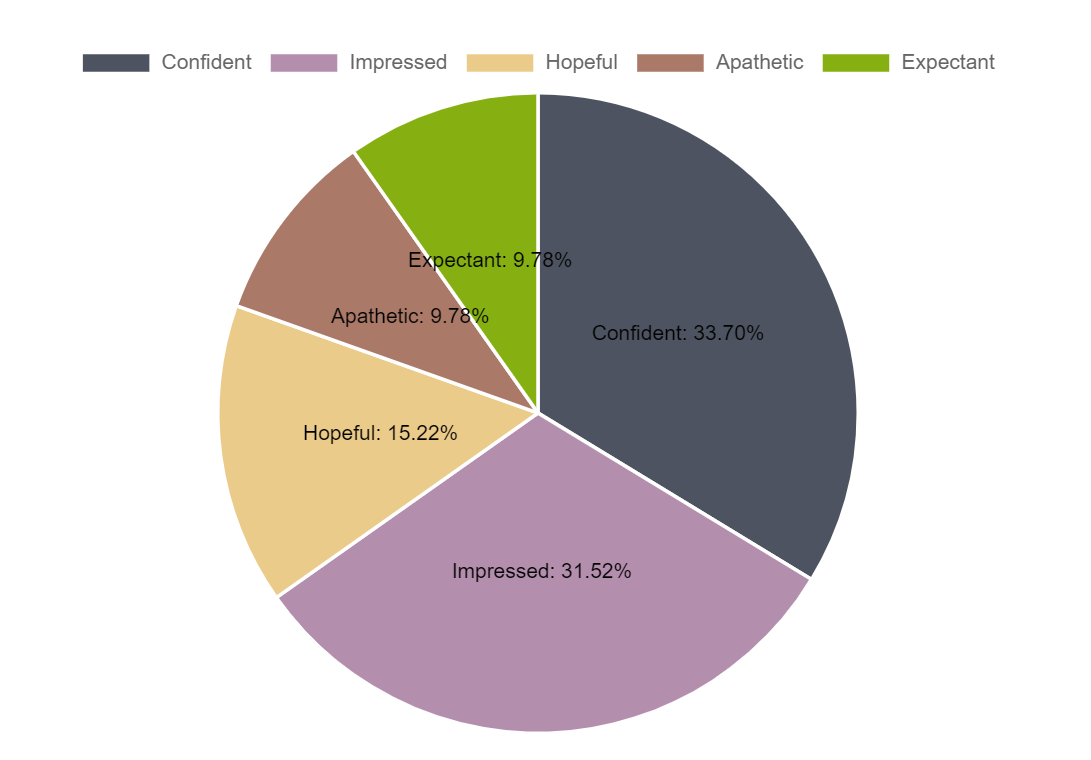
The pie chart presented provides a succinct and visual representation of the emotional responses elicited from users, such as while they are engaging with video content. Each segment’s arc length indicates the prevalence or intensity of the emotion during the experience, offering an at-a-glance indication of the emotional landscape that the content has engendered. The interactive features of the web-based version enhance its utility, permitting users to isolate and scrutinize specific emotions, thereby aiding in-depth analytical pursuits.
Such a detailed depiction of emotional distribution is invaluable across various domains. For instance, public speakers can utilize this data to calibrate their delivery for maximum impact, by identifying emotional responses that align with the desired outcome of their speech. In the realm of education, this chart becomes a tool for educators to gauge the emotional engagement of students, allowing for real-time adjustment of pedagogical strategies to better resonate with their audience. This chart encapsulates key emotional feedback, offering strategic insights that are critical for tailoring communication, enhancing interactive experiences, and ultimately fostering a more emotionally intelligent exchange between content and viewer.
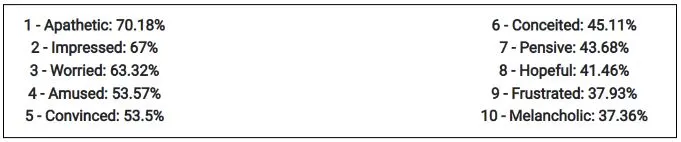
Extending from the top-5, this bar chart ranks the top ten emotional affects by their average prevalence throughout the entire video duration.
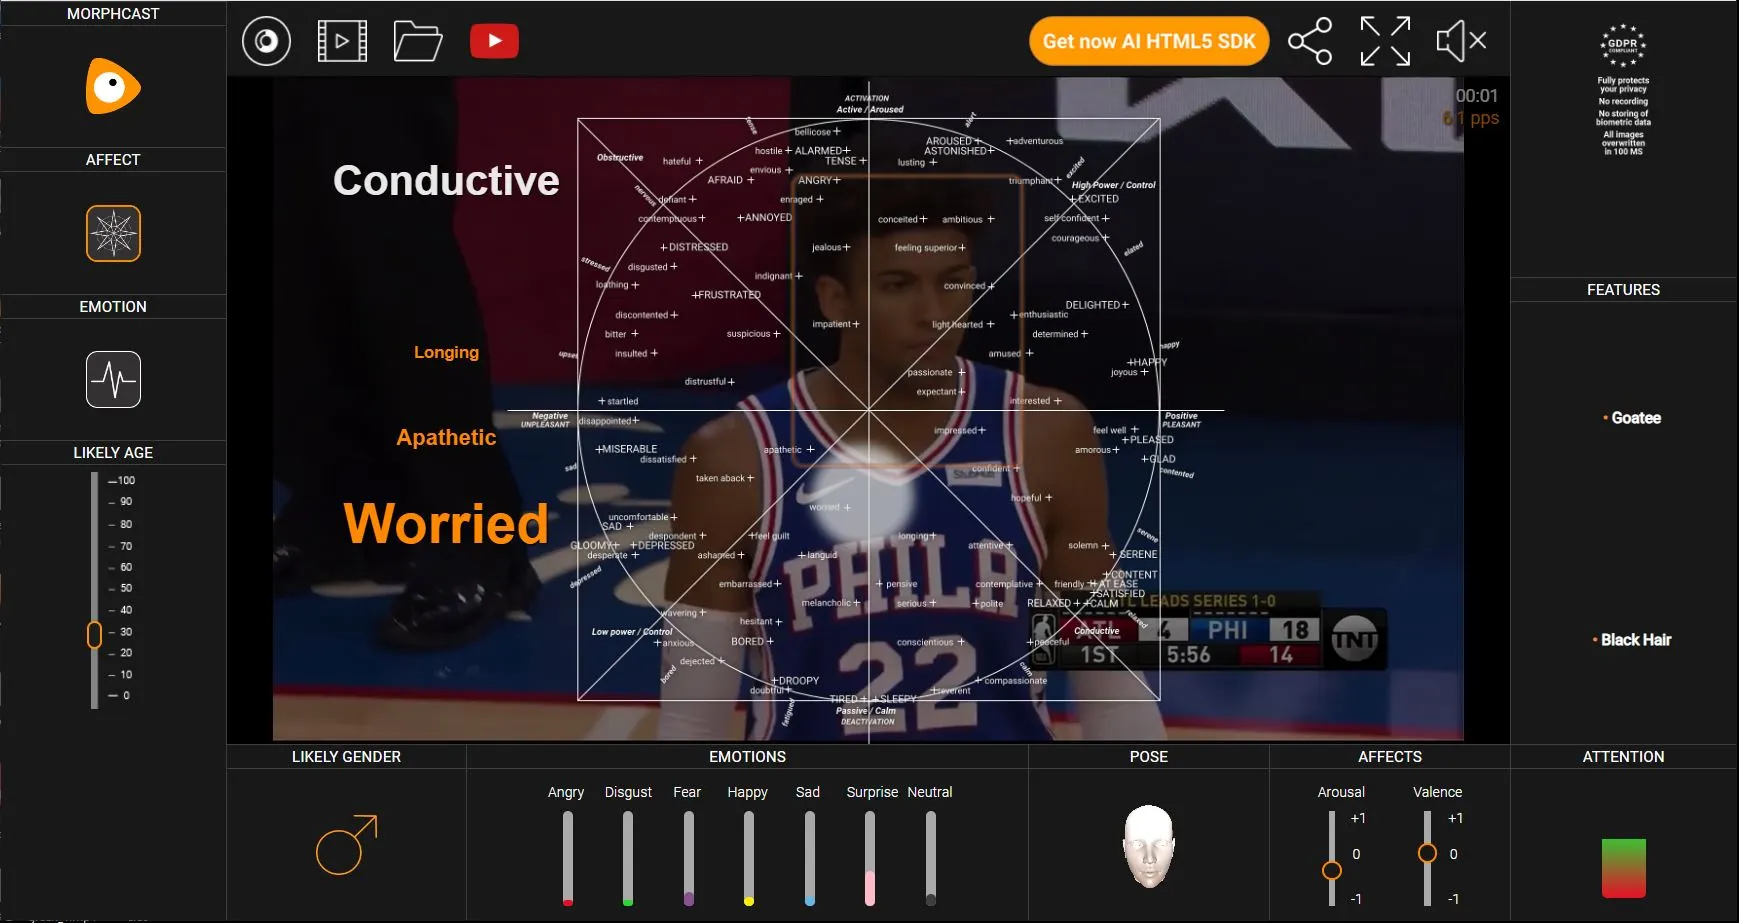
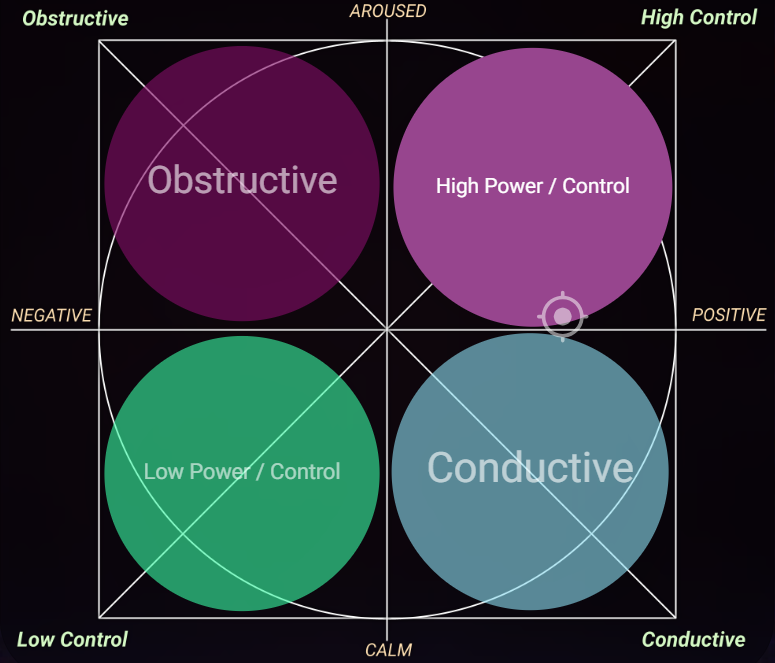
Quadrant Polar Area
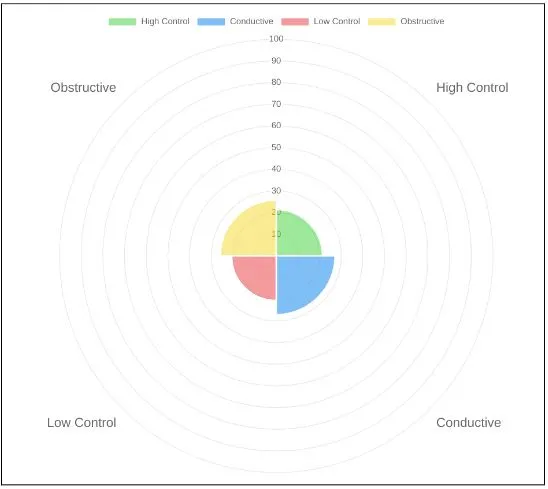
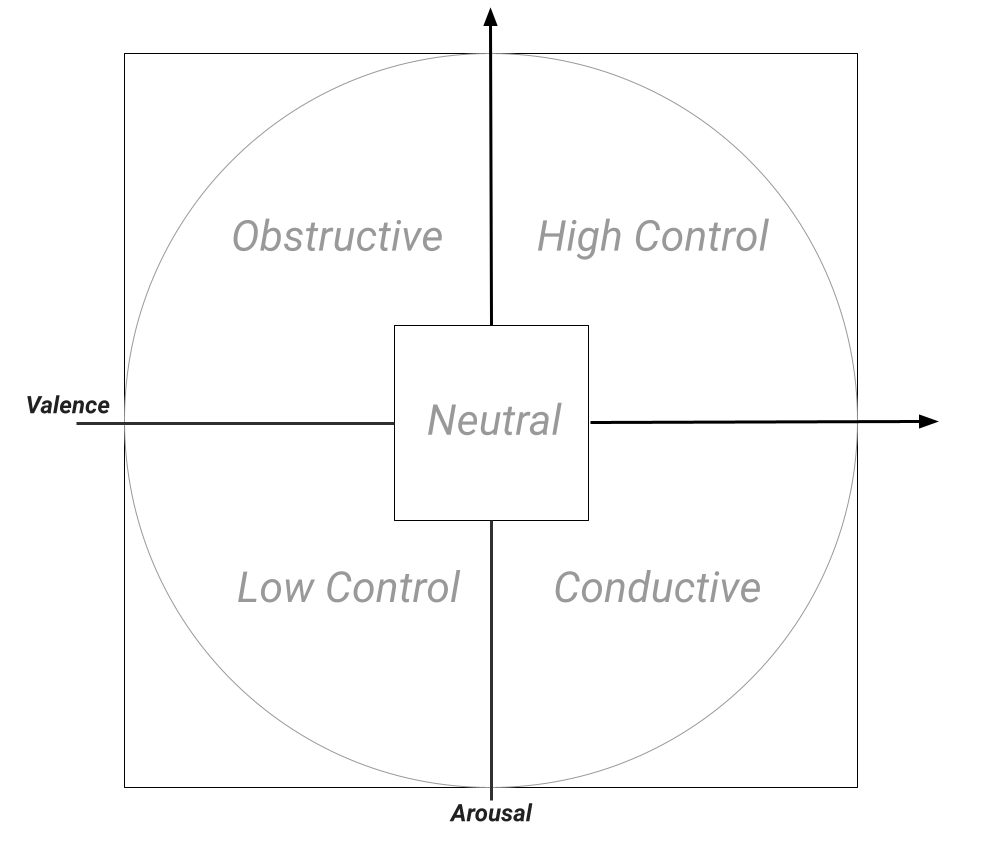
This Quadrant Polar Area chart depicts the distribution of emotional responses. This chart segments emotions into four quadrants: High Control, Conductive, Low Control, and Obstructive. These categories are based on the degree of control an individual perceives and whether their emotions are conducive or obstructive to their goals.
In educational contexts, this tool can be particularly insightful. For example, if a student predominantly exhibits emotions in the Obstructive quadrant during a learning session, it might suggest challenges in understanding the material or possible misconceptions. On the other hand, a tendency towards the Conductive quadrant could indicate effective learning and positive engagement.
Quadrant Radar
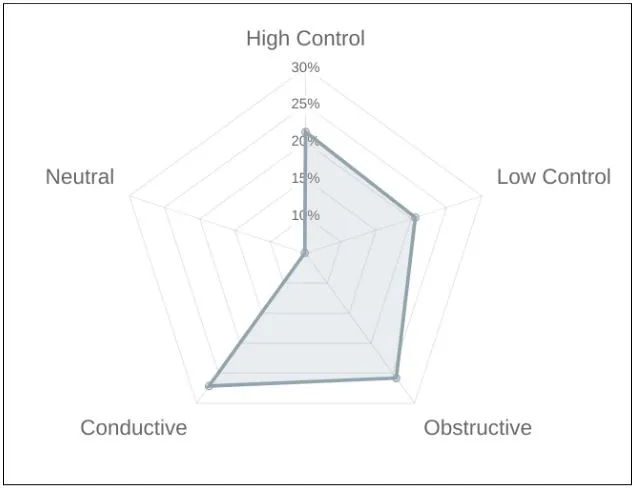
This radar chart presents a quantitative analysis of user interactions across five behavioral metrics, as identified by Morphcast AI. Each axis represents a different behavioral dimension:
- High Control: Measures the user’s level of control over the interaction flow. Greater percentages indicate more control.
- Low Control: Quantifies the lesser degree of user control during the interaction. Lower percentages suggest passive engagement.
- Obstructive: Assesses behaviors that hinder the interaction process. Higher values may indicate challenges within the user experience.
- Conductive: Represents behaviors that facilitate smooth interaction. Higher percentages reflect positive user engagement.
- Neutral: Gauges the extent of neutral behavior that neither distinctly aids nor obstructs the interaction.
The shaded area within the radar chart outlines the composite behavioral profile derived from user interactions. The extent of the shaded area in relation to the center reflects the intensity of the exhibited behavior in each dimension.
By interpreting this chart, stakeholders can understand the user experience dynamics and pinpoint areas for enhancement or further analysis.
During the analysis of a televised interview or debate, the Quadrant Polar Area and Quadrant Radar graphs can reveal how an interviewee manages emotional control in high-pressure situations and which emotions dominate the discussion. This can be useful for media professionals to better understand the emotional dynamics among participants.
The Basic Emotions of Paul Ekman
Paul Ekman’s theory of basic emotions represents a seminal development in the field of emotion studies, contributing significantly to our understanding of facial expressions and their link to emotional states. Paul Ekman, an American psychologist, is renowned for his research on the global universality of human emotions, indicating that some emotional experiences and their associated facial expressions are remarkably similar across cultures. This has far-reaching implications for emotional response, detailed analysis, and a way to analyze emotional action and reactions, even in such practices as applications of Emotion AI.
The Six Basic Emotions
Ekman’s initial theory, put forth in the 1970s and later refined, suggests that there are six biologically and evolutionarily derived fundamental emotions that are hard-wired into the brains of humans and are acknowledged across every culture in the world. These global emotions are rooted in human biology and central to the old debate between what’s learned (cultural standards) and instinctive emotional reactions. The six basic emotions identified by Ekman are:
- Happiness is generally paired with visible changes such as smiling and can include a pleasurable general mood, laughter, and deep expressions of exuberance.
- Sadness reflects various conditions of melancholia, loneliness, emotional pain, and can be denoted through posture and particular expressions, commonly signifying an unfavorable event.
- Fear is rooted in threats or unparalleled security of the personal self, considered to be principal for absolute living and life decision making. It is shown by most of the next inherited facial and expansive parts of the biological self.
- Disgust may come in varying severity from person to person but typically sparks a negative confirmation, repulsion, or overall conceit to a spate of events, items, or situations, leading to consequential and deep happenings of dissonance.
- Anger can be light as distrust or something deeply implosive or present outright; it may lead to some slightly depressed behaviors and cognitive plans, for this may have societal implications on the spread of negative conscious entity.
- Surprise is made in a general enthusiasm, a sally of unknown value or marker, and this can be either a hard-earned profit of real pleasure or a marker of minute oral incidents.
Bibliography:
Emotions Distribution (Donut Chart)
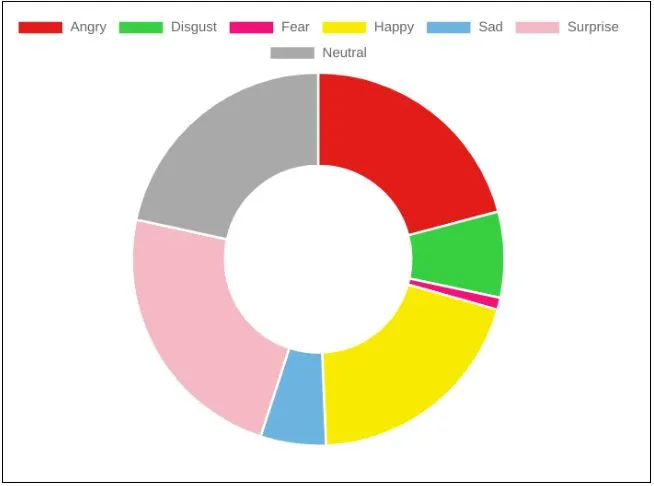
The donut chart displayed visualizes the distribution of emotional responses as detected by Morphcast’s behavioral analysis. Each colored segment corresponds to a specific emotion, with the size of the segment reflecting the relative frequency of that emotion during the observation period. The emotions detected include:
- Angry: depicted in red.
- Disgust: shown in dark green.
- Fear: marked in gray.
- Happy: displayed in yellow.
- Sad: identified by blue.
- Surprise: represented in purple.
- Neutral: indicated in light gray.
The proportion of each segment illustrates the prevalence of the corresponding emotion, providing a clear picture of the overall emotional profile captured. This visual tool allows users to quickly discern the dominant emotions and assess the general emotional balance observed.
Emotions Over Time
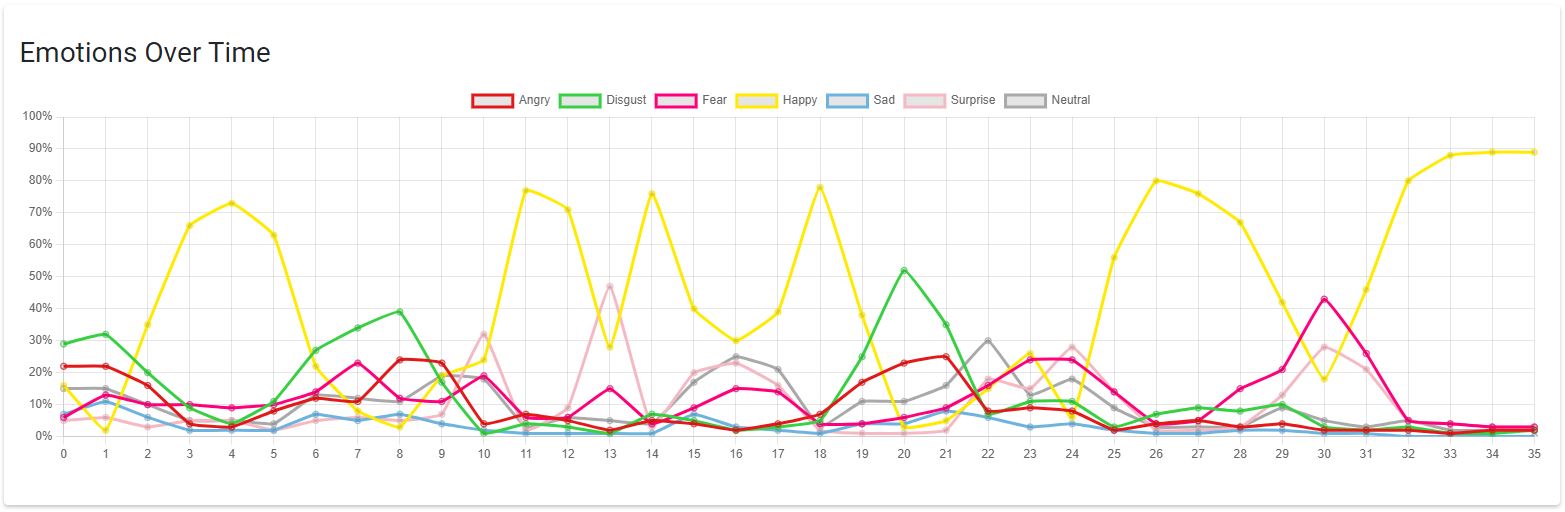

This line graph represents the variation of emotional responses over time as detected by our system. Each color-coded line corresponds to an emotion:
- The red line indicates Angry.
- The green line shows Disgust.
- The gray line traces Fear.
- The yellow line represents Happy.
- The blue line denotes Sad.
- The pink line reflects Surprise.
- The light gray line is for Neutral emotions.
The vertical axis indicates the percentage of observed emotion, ranging from 0% to 100%, which signifies the proportion of participants exhibiting that emotion at any given time. The horizontal axis is labeled with numbers representing sequential time intervals, which could be in units of time such as seconds, minutes, hours, or even days depending on the context of the data collection.
By observing the graph, one can discern the prevalence and intensity of emotional responses throughout the duration of the monitored activity. Peaks and troughs in the lines may correlate with specific stimuli or events, providing insights into how emotions evolve and interact over the course of the experience. This information is critical for understanding audience engagement and the emotional impact of the content presented.
Engagement Over Time
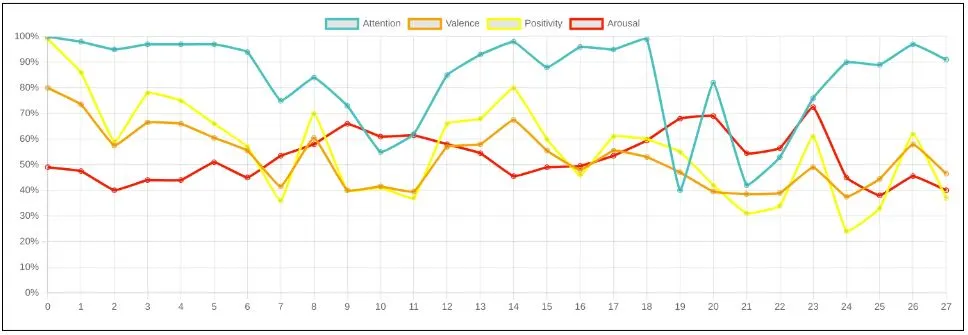
This line graph is titled “Engagement Over Time” and it charts the progression of four key metrics over a series of time intervals. The metrics measured are:
- Attention: depicted with a cyan line, indicates the level of focus that the audience has on the content.
- Valence: shown with an orange line, measures the positive or negative sentiment elicited from the audience.
- Positivity: represented by a yellow line, tracks the degree of positive response.
- Arousal: marked with a red line, assesses the intensity of emotional stimulus.
The vertical axis represents the percentage, ranging from 0% to 100%, showing how much of the audience is exhibiting a particular response at each time interval marked along the horizontal axis. The data points on the graph can help identify patterns of engagement, such as moments of high attention or increased positivity, and can also highlight how these different metrics correlate with each other over the duration of the experience. Understanding these dynamics is essential for evaluating content performance and audience engagement strategies.
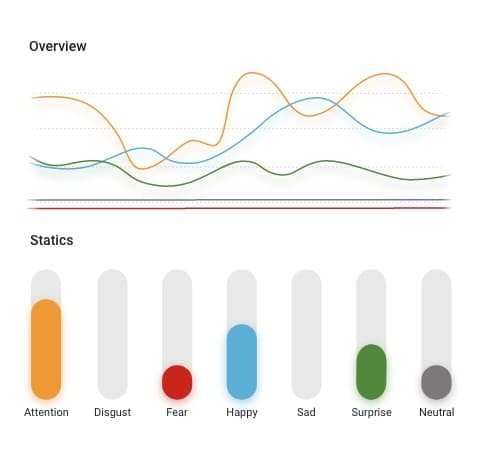
In our products and plugins designed for videoconferencing, we frequently utilize a real-time chart to display engagement metrics. This chart, as illustrated in the image, showcases two key parameters:
- Attention: Represented by a line and a corresponding gauge, it quantifies the level of attention participants are giving. The gauge provides a snapshot of the current attention level, while the line graph tracks its variation over time.
- Arousal: Denoted by a line and a gauge, it measures the intensity of emotional responsiveness. Similar to the attention gauge, the arousal gauge indicates the real-time measurement, and the line graph depicts the fluctuations throughout the session.
The line graph below the gauges plots these metrics over a specified timeline, marked on the horizontal axis. The vertical axis, scaled from 0% to 100%, reflects the intensity of each metric. High attention levels would typically indicate that the participants are focused and engaged with the content, while varying levels of arousal can suggest different levels of emotional reaction or stimulation. Together, these indicators provide a comprehensive view of audience engagement in real-time, enabling performer and moderators to adapt their strategies for better engagement and interaction.
Wish Over Time
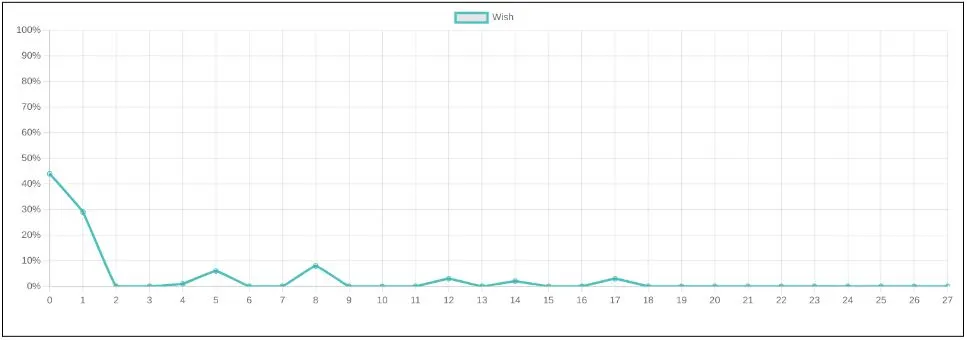
The line graph displayed is a visual representation of the ‘Wish’ metric over time, a unique signal developed by our AI technology. This metric is designed to gauge desire, interest, or expectation based on the analysis of facial expressions and mood variations. The metric begins with an initial calibration on the individual’s facial structure to ensure accuracy and then tracks slight mood variations over time, enhancing sensitivity to microexpressions.
As the timeline advances, the ‘Wish’ metric may rise or fall, depicting the viewer’s shifting emotional responses to the content. This graph is an invaluable tool for pinpointing moments when a viewer is most likely to express a wish, particularly useful for e-commerce platforms where timing for presenting a shopping link or graphic related to a product can be crucial. By aligning these visual prompts with the moments of highest ‘Wish’ metric readings, it’s possible to capture and act upon the viewer’s peak interest level, potentially increasing engagement and sales.
CSV data file
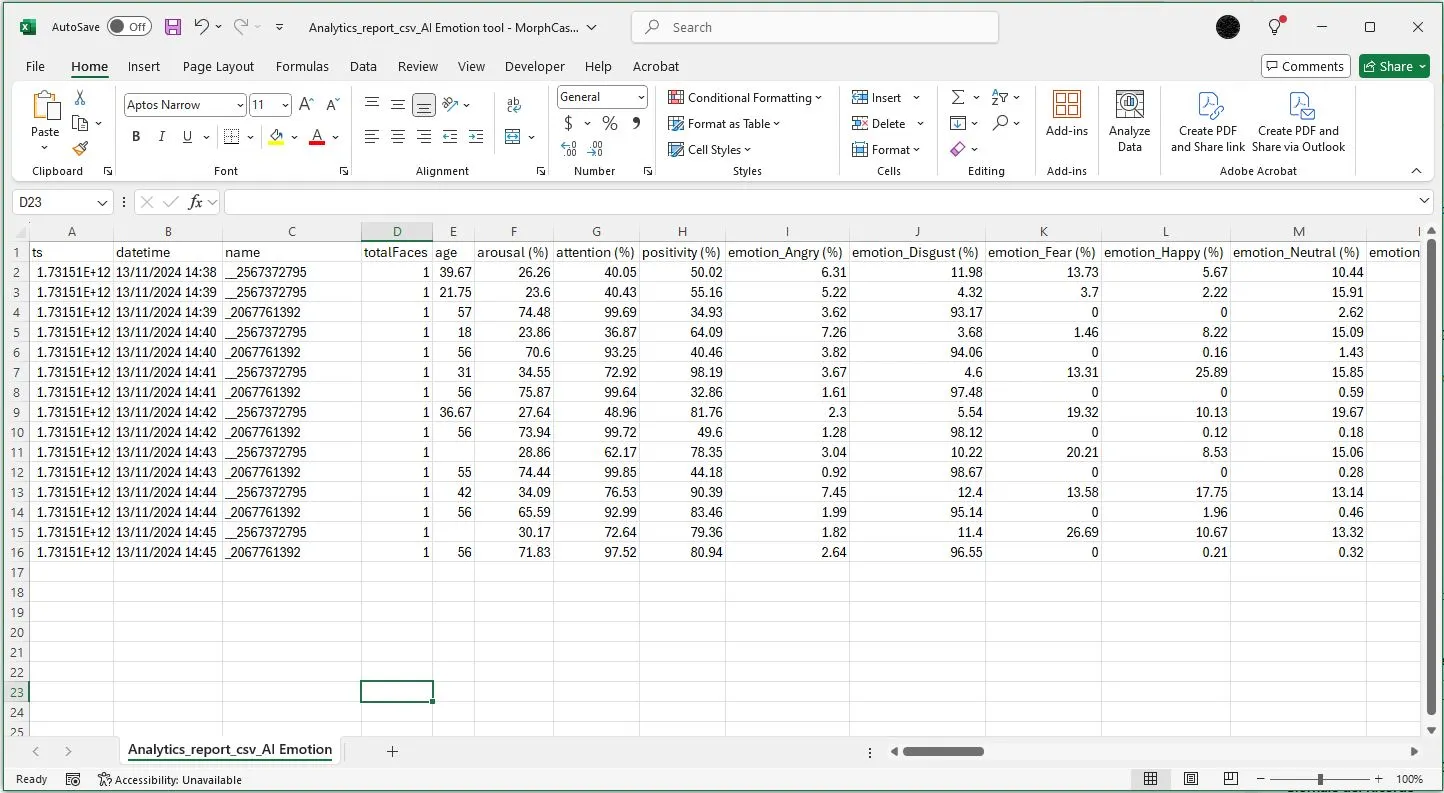
With MorphCast, you can easily download the emotional and behavioral analysis results as a CSV file. The CSV (Comma-Separated Values) format is a simple and widely compatible way to explore the data generated during video interaction.
What is a CSV file?
A CSV file is a structured text file where data is organized in rows and columns. In the context of MorphCast, each row represents a specific time interval in the video (typically one second), and contains all the information captured during that moment.
Why choose the CSV format?
The CSV format is ideal when you want:
- Full access to raw data for in-depth exploration
- The ability to customize your analysis or create specific visualizations
- To integrate the data into tools like Excel, Google Sheets, Power BI, or Tableau
- To merge this emotional data with your own business data, like website interactions, CRM info, or survey responses
The CSV format gives you flexibility and control. You decide what to focus on, how to visualize the data, and how to connect it with the rest of your strategy.
Is the CSV easy to use?
Absolutely. You can open the file with:
- Microsoft Excel
- Google Sheets
- Any spreadsheet software
- Tools that support CSV import (e.g. BI dashboards or code-based environments)
Even if you’re not a technical user, you can read and explore the data thanks to its clear, column-based layout. Each metric is labeled in a consistent and intuitive way.
You can also download the data as a JSON file and, in some cases, as a PDF dashboard.
Each row in the CSV represents a specific time interval (in seconds) within the video, containing aggregated data on various emotions and behaviors detected.
Main Data Categories
- Video Time:
video_time: Timestamp in seconds for each frame analyzed.
- Face Count:
totalFaces_min: Minimum number of faces detected in that second.totalFaces_max: Maximum number of faces detected.totalFaces_samples: Total number of face detections in that second.
- Emotional Attributes:
- Arousal (Activation Level):
arousal_avg: Average arousal level for that second.arousal_min,arousal_max: Minimum and maximum arousal detected.arousal_last: Last arousal value recorded within the second.arousal_samples: Number of arousal detections for that second.
- Valence (Emotional Valence):
valence_avg: Average valence for frames within that second.valence_min,valence_max: Minimum and maximum valence detected.valence_last: Final valence value for that second.valence_samples: Number of valence detections for that second.
- Positivity:
positivity_avg,positivity_min,positivity_max,positivity_last,positivity_samples: Statistics on positivity levels for that second.
- Wish:
wish_avg,wish_min,wish_max,wish_last,wish_samples: Statistics on desire or engagement level for that second.
- Arousal (Activation Level):
- Affects:
- Affects Categories: The CSV also includes detailed affective states like “Annoyed,” “Anxious,” “Calm,” “Happy,” “Hopeful,” “Sad,” and more. These are specific emotional states that provide a nuanced view of responses beyond basic emotions.
- Each affect has similar statistics as other attributes:
affects_[Affect]_avg: Average level of a specific affect.affects_[Affect]_min,affects_[Affect]_max: Minimum and maximum values for that affect.affects_[Affect]_last: Last recorded value of that affect.affects_[Affect]_samples: Number of detections for that affect in the second.
- How to Use: Reviewing these affects can help identify the diversity of emotional responses, such as a mix of “Happy” and “Calm,” which might signal both enjoyment and comfort.
- Specific Emotions:
- Core Emotions:
emotion_Happy,emotion_Sad,emotion_Angry,emotion_Fear,emotion_Disgust,emotion_Surprise,emotion_Neutral: Each emotion includes statistics on average, minimum, maximum, last value, and sample count.
- Core Emotions:
- Attention:
attention_avg,attention_min,attention_max,attention_last,attention_samples: Statistics on viewer’s attention level in each second.
- Emotional Quadrant Distribution:
quadrant_distribution_Conductive,quadrant_distribution_High Control,quadrant_distribution_Neutral,quadrant_distribution_Obstructive: Percentage of time that emotions were classified into each quadrant, offering a broader emotional category.
Interpreting Data
Each attribute includes several statistics that offer insights into emotional and behavioral trends in each second of the video:
- Average (
_avg):- Provides an overall intensity level of the attribute for that second. For example, a high
valence_avgindicates predominantly positive emotions, while a higharousal_avgshows an active or engaged emotional state.
- Provides an overall intensity level of the attribute for that second. For example, a high
- Minimum and Maximum (
_min,_max):- Show the range within each second, capturing fluctuations in intensity. For instance, a wide range between
arousal_minandarousal_maxmay indicate varying engagement levels or mixed emotional responses.
- Show the range within each second, capturing fluctuations in intensity. For instance, a wide range between
- Last (
_last):- Reflects the final state at the end of each second, helpful for spotting trends. An increasing
valence_lastacross seconds could signify a growing positive response over time.
- Reflects the final state at the end of each second, helpful for spotting trends. An increasing
- Samples (
_samples):- Indicates the number of detections or frames analyzed, adding reliability to the other statistics. More samples mean more robust data for understanding trends.
By examining these values together, you can gain a detailed, second-by-second understanding of the emotional and behavioral responses throughout the video, spotting patterns, fluctuations, and overall trends in audience reactions.
Contacts
If you experience any damage or abuse using our platform, please inform us using this form on our website.
For any clarifications and/or problems related to the operation of the Software with respect to privacy, please contact privacy@cynny.com.
For any other inquiries, please use this contact form.